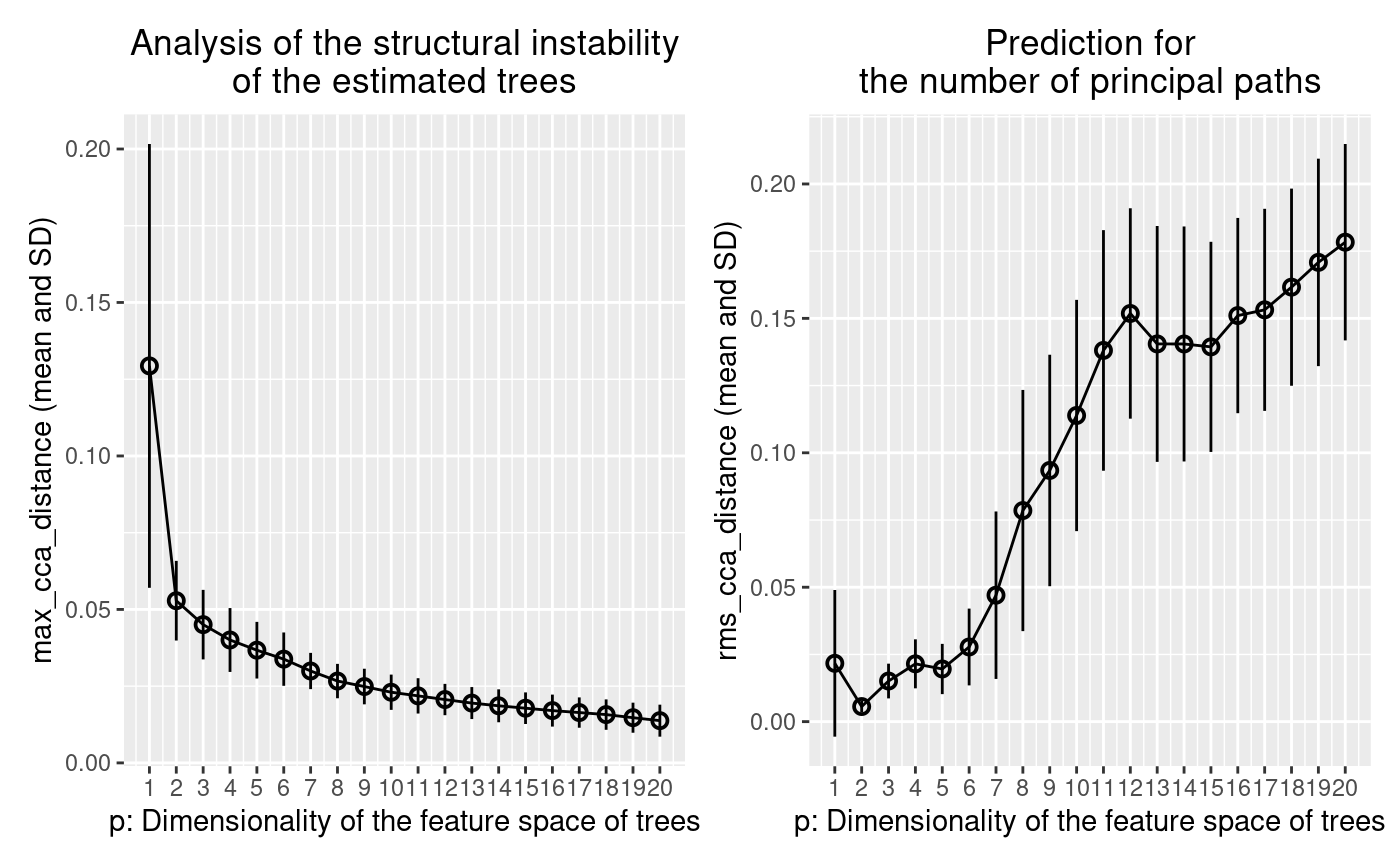
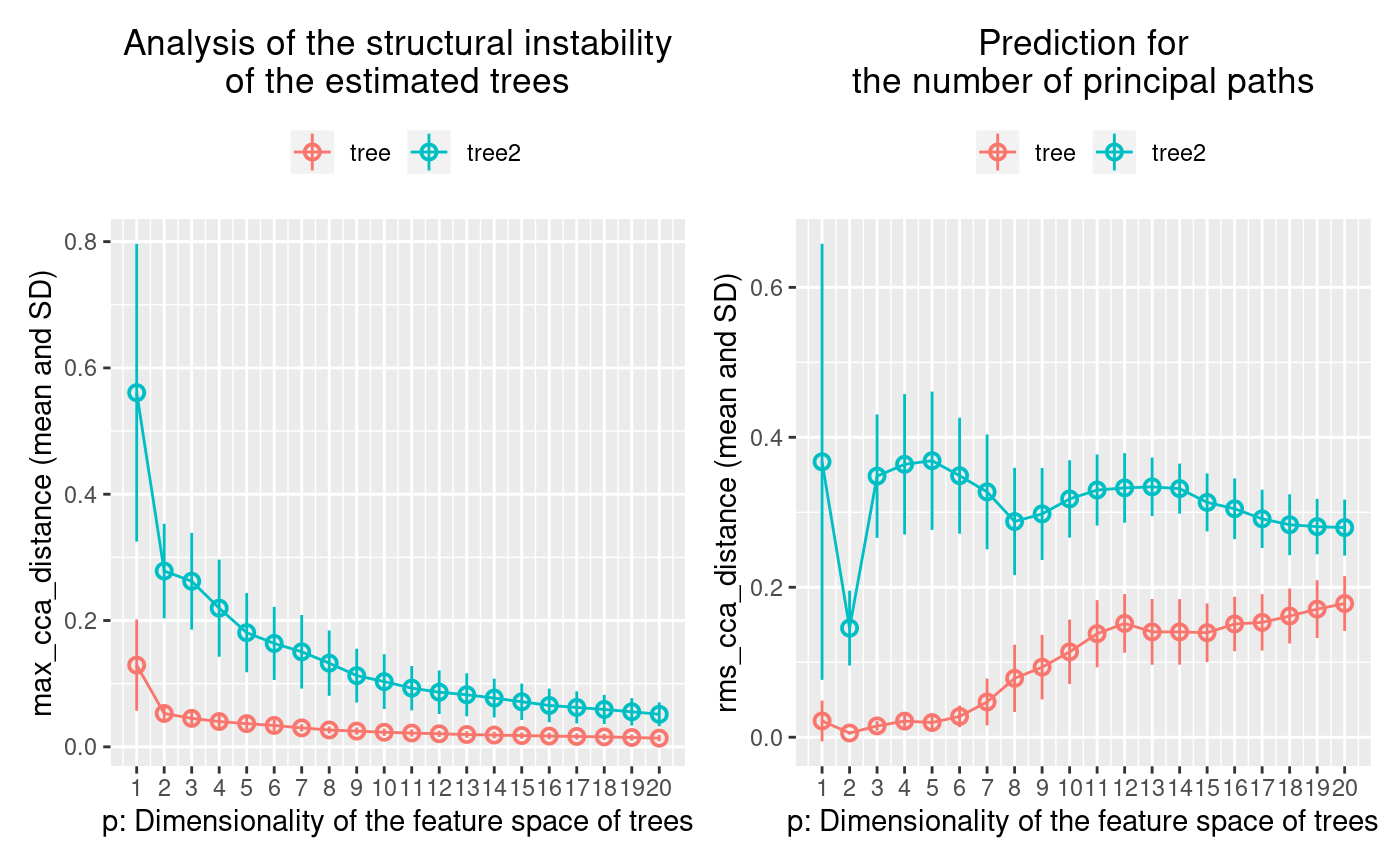
Plot estimate results to get insight.
# S3 method for treefit
plot(x, ...)
Arguments
| x | The estimated result by |
|---|---|
| ... | The more estimated results to be visualized together or other graphical parameters. |
Value
A plot object as a ggplot object. It plots the given one
or more estimated results to get insights from one or more
treefit() results.
Examples
# Generate a tree data. tree <- treefit::generate_2d_n_arms_star_data(200, 3, 0.1) # Estimate the goodness-of-fit between tree models and the tree data. fit <- treefit::treefit(list(expression=tree), "tree") # Visualize the estimated result. plot(fit)# You can mix multiple estimated results by adding "name" column. tree2 <- treefit::generate_2d_n_arms_star_data(200, 3, 0.9) fit2 <- treefit::treefit(list(expression=tree2), "tree2") plot(fit, fit2)